Investing in the stock market offers opportunities for wealth creation, but it also comes with inherent risks, including market corrections. Understanding these corrections is crucial for investors aiming to make informed decisions and maintain a long-term perspective.
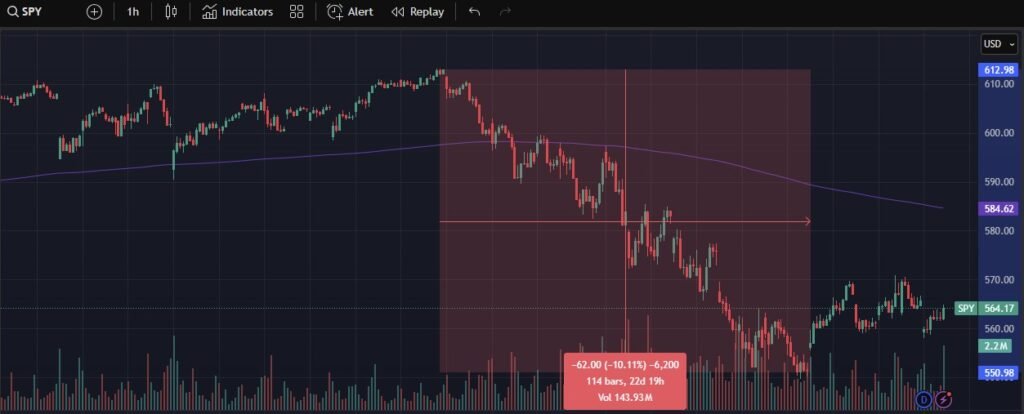
As of March 2025, the S&P 500 has declined by approximately 10% from its recent highs, marking its first 10%+ correction since 2022. However, it’s worth noting that the S&P 500 also experienced a notable decline in August 2024, falling approximately 7.4% from its peak. While that drawdown did not meet the technical threshold for a correction, it reflected growing concerns about sticky inflation and slowing corporate earnings, serving as a precursor to the current broader pullback. This decline has unfolded over a six-week period and reflects mounting concerns about slowing consumer demand, tighter monetary conditions, and broader economic uncertainty. While corrections like this can feel unsettling, they are not unprecedented—and when placed in historical context, they often serve as important reminders of the cyclical nature of markets.
What are Market Corrections?
Market corrections refer to a decline of 10% or more in the price of a security, asset, or financial market from its most recent peak. These corrections are a natural part of market cycles and can occur across various asset classes, including stocks, bonds, commodities, and real estate. Corrections are different from bear markets, which involve a 20% or greater drop, and crashes, which often exceed 30% declines.
While the term “correction” may sound alarming, these movements serve to “correct” overvalued markets and often lead to healthier long-term growth by removing excess speculation.
Historical Frequency and Duration of Corrections
Historically, corrections in the S&P 500 occur on average once every 1.8 years. Since the 1950s, there have been over 38 corrections, making them a normal and expected part of the investment journey. While unpredictable in timing, their frequency and recovery patterns are relatively consistent.
- Average frequency: Every 1.84 years
- Average duration of a correction: ~3 to 4 months
- Average recovery time: ~4 to 6 months
More severe downturns (bear markets or crashes) tend to last longer and may require several years to recover. For example:
- Bear markets (20%+): Occur roughly once every 7 years. The most recent bear market occurred in 2022, when the S&P 500 declined by approximately 25% due to surging inflation, rapid interest rate hikes by the Federal Reserve, and growing fears of a recession. The downturn lasted about 10 months, with a full recovery taking an additional 8 months.
- Crashes (30%+): Occur about once per decade. The most recent example was the 2020 COVID-19 crash, which saw the S&P 500 plummet 34% in just over a month. Despite the steep drop, it became one of the fastest recoveries in history—rebounding within six months—thanks to massive monetary and fiscal stimulus measures.
What Causes Market Corrections?
Corrections often stem from a range of triggers, including:
- Economic Indicators: Poor GDP growth, declining corporate earnings, or rising unemployment rates can undermine investor confidence.
- Monetary Policy: Sudden interest rate hikes or policy tightening by central banks can reduce liquidity and spook markets.
- Geopolitical Events: War, trade conflicts, and political instability increase uncertainty and cause capital flight.
- Overvaluation: When prices are stretched beyond fundamentals, markets may self-correct.
- Black Swan Events: Rare and unpredictable events like pandemics or financial crises can trigger rapid declines.
In the case of the March 2025 correction, the market’s decline has been driven by a combination of slowing consumer spending, persistent inflation in certain sectors, and tightening financial conditions due to ongoing interest rate pressure. Recent earnings reports have shown signs of weakness in key consumer discretionary and retail sectors, suggesting a softening demand outlook. Additionally, investor sentiment has been weighed down by uncertainty around the Federal Reserve’s next moves, especially given mixed signals on inflation trends. Another important contributor has been the policy ambiguity regarding international trade that has come from the Trump administration. Markets have grown increasingly uneasy with the administration’s back-and-forth stance on tariffs, particularly in relation to major trading partners like China and the European Union. The lack of consistency has raised fears of a renewed trade war or supply chain disruptions, adding to the uncertainty and risk aversion among investors. The combination of cautious corporate guidance, reduced risk appetite, geopolitical unease, and macroeconomic slowdown has contributed to a broad pullback, with volatility rising across equity markets as investors reassess their expectations for growth in the second half of 2025.
Key Past Market Corrections and Crashes
Understanding past market corrections helps investors recognize patterns and make more informed decisions. Below is a detailed overview of major market drawdowns, their causes, how long they lasted, and how markets ultimately recovered.
1. The Global Financial Crisis (2007–2009)
- Drawdown: -57%
- Duration: 17 months to bottom, ~5.5 years to recover
- Cause: A collapse in the U.S. housing market triggered by subprime mortgage defaults led to widespread financial system failures. Banks and financial institutions globally were deeply entangled in mortgage-backed securities, leading to insolvencies, credit freezes, and plummeting investor confidence.
- Recovery: Massive monetary and fiscal stimulus measures were enacted, including the Troubled Asset Relief Program (TARP), quantitative easing (QE), and aggressive interest rate cuts by the Federal Reserve. The market slowly recovered, but it took over five years to return to pre-crisis highs.
2. The COVID Crash (2020)
- Drawdown: -34%
- Duration: Only 33 days to bottom, full recovery in 6 months
- Cause: The global outbreak of COVID-19 led to unprecedented shutdowns of economies, surging unemployment, and severe drops in corporate earnings projections. Markets reacted swiftly in anticipation of deep economic fallout.
- Recovery: Recovery was equally dramatic. Central banks, including the Fed, cut rates to near-zero and launched large-scale asset purchases. Governments passed massive fiscal stimulus packages. The speed and scale of these actions enabled a sharp rebound.
3. Dot-Com Bubble Burst (2000–2002)
- Drawdown: -49%
- Duration: Nearly 3 years to bottom, 7 years to recover
- Cause: Overvaluation of tech stocks during the internet boom led to a bubble, which burst when earnings failed to meet expectations. Investor euphoria turned to fear, and high-profile corporate scandals (Enron, WorldCom) further eroded trust.
- Recovery: The Federal Reserve gradually cut interest rates, but broader economic and confidence damage meant the market didn’t fully recover until 2007.
4. 2018 Trade War Correction
- Drawdown: -20%
- Duration: 3 months to bottom, 4 months to recover
- Cause: Heightened trade tensions between the U.S. and China, combined with aggressive Fed rate hikes, sparked investor fears of slowing global growth. Equity markets sold off sharply in Q4.
- Recovery: The Fed signaled a pause in rate hikes and adopted a more dovish tone in early 2019. Trade negotiations also made progress, easing investor concerns and supporting a rebound.
5. 2011 European Debt Crisis
- Drawdown: -19%
- Duration: 6 months to bottom, 5 months to recover
- Cause: Sovereign debt issues in Greece, Italy, and other Eurozone countries triggered fears of systemic collapse. The U.S. also saw its credit rating downgraded by S&P for the first time in history, further amplifying risk-off sentiment.
- Recovery: European Central Bank (ECB) interventions and coordinated global efforts helped restore some investor confidence. U.S. economic data also began to stabilize.
6. 1987 Black Monday Crash
- Drawdown: -34%
- Duration: Market bottomed in 3 months, recovered within 2 years
- Cause: A mix of overvaluation, programmatic trading algorithms, and investor panic led to a single-day drop of 22.6% on October 19, 1987—the largest one-day percentage loss in U.S. history.
- Recovery: The crash was not followed by a recession. Swift Fed action to reassure markets and inject liquidity helped fuel a surprisingly strong recovery within two years.
How Fast Do Corrections Happen?
Some corrections unfold over weeks or months, while others happen in mere days. Here’s a broader look at how quickly some of the most notable corrections have reached the 10% mark:
| Year | Event | Days to 10% Drop | Notes |
|---|---|---|---|
| 1987 | Black Monday | 7 days | Largest single-day drop in history; drop driven by program trading |
| 2000 | Dot-Com Bust (early phase) | ~60 days | Gradual decline following peak overvaluation of tech stocks |
| 2008 | Global Financial Crisis | ~50 days | Subprime defaults and banking collapse triggered steep decline |
| 2011 | European Debt Crisis | ~20 days | U.S. debt downgrade, Eurozone fears |
| 2018 | February Flash Correction | 13 days | Triggered by Fed rate hike fears and volatility in bond markets |
| 2020 | COVID Crash | 6 days | Fastest correction on record due to pandemic panic |
| 2022 | Inflation Correction | 30 days | Persistent inflation and rapid Fed rate hikes |
| 2024 | August Pullback | ~18 days | A 7.4% drop tied to inflation and earnings fears (not a full correction) |
| 2025 | Current Correction | 20–30 days | Slowing consumer demand, policy uncertainty, tariff risk |
How Long Do Corrections and Crashes Last?
| Category | Average Duration to Bottom | Average Recovery Time |
| 10%+ Corrections | 3 months | 4–6 months |
| 20%+ Bear Markets | 11 months | 1–2 years |
| 30%+ Crashes | 17 months | 3–5 years |
The faster the drop, the faster the recovery—especially when the cause is not structural (e.g., COVID vs. 2008).
Currently, investors are closely watching a mix of signals to determine whether the market has reached the bottom of the March 2025 correction. On the one hand, stabilizing inflation in key areas like energy and housing, alongside better-than-expected earnings from some sectors (notably technology and healthcare), suggests that the worst may be behind us. Volatility indexes (like the VIX) have also begun to retreat from recent highs, and investor sentiment surveys show a modest rebound in risk appetite.
On the other hand, continued weakness in consumer spending, soft retail sales data, and uncertainty around the Federal Reserve’s next policy move keep downside risks in play. Additionally, the ongoing ambiguity surrounding U.S. trade policy has yet to be resolved, further clouding the outlook. Until we see a more sustained improvement in economic momentum and earnings breadth, it remains unclear whether this correction has truly bottomed or if further volatility lies ahead.
Lessons for Investors
Corrections, bear markets, and even crashes are difficult to endure—but they’re also an unavoidable part of the investing journey. For investors, the key is not to avoid them, but to understand them, prepare for them, and capitalize on the opportunities they create.
Historically, the investors who stay invested during turbulent periods tend to outperform those who panic and exit the market. This is because market recoveries are often swift and unexpected—missing just a few of the best recovery days can significantly reduce long-term returns.
In addition to mindset, there are several concrete steps investors can take:
- Rebalance portfolios during drawdowns to maintain strategic asset allocation. Declines in equities may require reallocating from fixed income or cash to restore balance.
- Focus on quality: Companies with strong balance sheets, resilient cash flow, and competitive advantages tend to hold up better during corrections and recover more quickly.
- Avoid emotional decisions: Selling at the bottom and buying at the top is a classic investor mistake. Historical data shows that markets always recover—even after the worst crashes.
- Diversify strategically: Holding a mix of asset classes, sectors, and geographies can buffer against downturns in any single area.
While it’s impossible to time the market perfectly, it’s entirely possible to be prepared for volatility. Corrections are not a reason to panic—they’re a reason to pause, review your strategy, and stay the course if your long-term plan remains intact.
Remember: the market has always recovered.
Conclusion
Market corrections, while uncomfortable, are a critical part of the market’s long-term function. They often emerge in response to economic, political, or financial imbalances and serve as a mechanism for resetting excessive valuations, cooling investor speculation, and realigning expectations with fundamentals. Over the last 50 years, the market has endured dozens of corrections and several major bear markets—and each time, it has recovered and moved higher.
The current correction in 2025 is a reminder of how quickly sentiment can shift in response to consumer weakness, policy ambiguity, and inflationary pressure. Unlike panicked crashes like 2020 or deep recessions like 2008, this drawdown appears to be more macro-driven and policy-sensitive. It highlights the importance of tracking a wide range of signals—economic data, earnings trends, inflation dynamics, and geopolitical developments—when assessing market direction.
What’s most important is maintaining perspective. As the data throughout this article illustrates, corrections often last just a few months and are frequently followed by meaningful rebounds. Investors who remain disciplined, diversified, and focused on quality tend to weather volatility better and come out stronger on the other side.
Whether this is your first or your fifteenth correction, the lesson remains the same: markets are resilient. Understanding the causes and consequences of past downturns helps frame the current environment and empowers investors to make informed, confident decisions moving forward.