
London clears mountains of gold … on paper
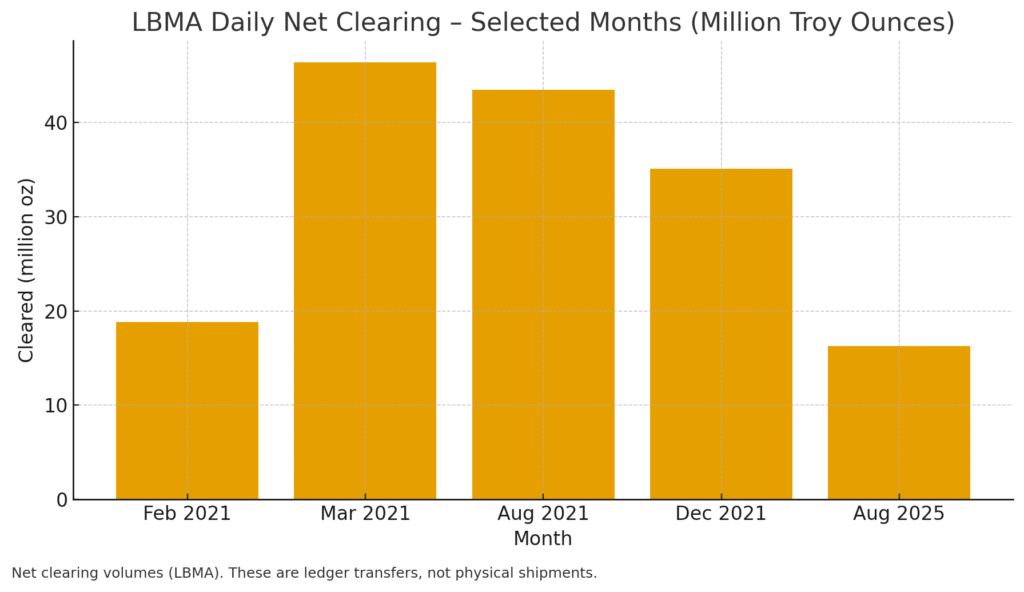
Every business day, a few bullion banks in London move the world’s gold ledger. The London Precious Metals Clearing Limited (LPMCL) nets and settles 20 million troy ounces per day on average. In practice, daily volumes often sit around 16–20 million oz (LBMA clearing data). That is enough metal to cover every wedding ring in India—several times.
Yet a drone over the Bank of England would see no action. The bars rarely move. Most volume comes from the over-the-counter (OTC) “loco London” market—paper transfers between unallocated accounts (according to LBMA).
The London OTC market remains the world’s dominant hub, handling about 70% of global notional trading (World Gold Council). Most gold trading happens off-exchange in London. Banks trade directly with each other and settle via clearing banks, not a central exchange. The market is less transparent, but LBMA Good Delivery standards and a tight vault network keep pricing credible. The Commodity Exchange (i.e, COMEX futures) in New York helps with hedging and short-term price signals, and only a small share of those contracts end in delivery. Asian exchanges such as the Shanghai Gold Exchange are growing, but together they still handle under one-third of global turnover.
Myth vs reality: volume ≠ shipments
Clearing volumes do not mean 20 million oz are trucked through London each day. The loco London system is a web of paper transfers between unallocated accounts. Members update ledgers for bilateral trades and third-party transfers; net positions settle once per day. Netting cuts gross exposures and “avoids the security risks and costs involved in the physical movement of bullion.” Only when a client requests allocation or delivery does metal move to an allocated bar. Most contracts close before that step.
Trading volume is a different measure. London’s OTC market can resell bars intraday (and sometimes rehypothecate) before books are netted. Futures markets like COMEX trade thousands of contracts that mostly cash-settle (CME Gold). As a result, clearing and trading volumes both exceed physical shipments—by design. Read headlines with that in mind.
How gold really moves: mines, refineries and vaults
Gold’s physical journey starts in mines in Africa, Australia, and the Americas. Its shape and purity are often set in Switzerland. According to Swiss customs and SECO, Switzerland refined about 34% of the world’s gold in 2023 and is often cited at 50–70% of newly mined gold over time. An AFP report shows exports to the U.S. surged from CHF 6.1 bn (≈US $6.8 bn, 2023 avg) to CHF 11 bn (≈ $12.5 bn, 2024 avg), then to CHF 39.2 bn in H1-2025 (≈ $46.7 bn, 2025 YTD avg).
Refiners in Ticino and Zurich cast 400-oz Good Delivery bars for London and 1 kg bars for Asia. Those bars move to vaults in London, Zurich, New York, or Dubai, then on to end-users.
From London, gold flows out again:
-
India/Middle East: jewellers melt bars into bangles.
-
ETFs: issuers hold stock to back shares.
-
Central banks: add to reserves.
-
Technology: uses small but steady volumes in electronics.
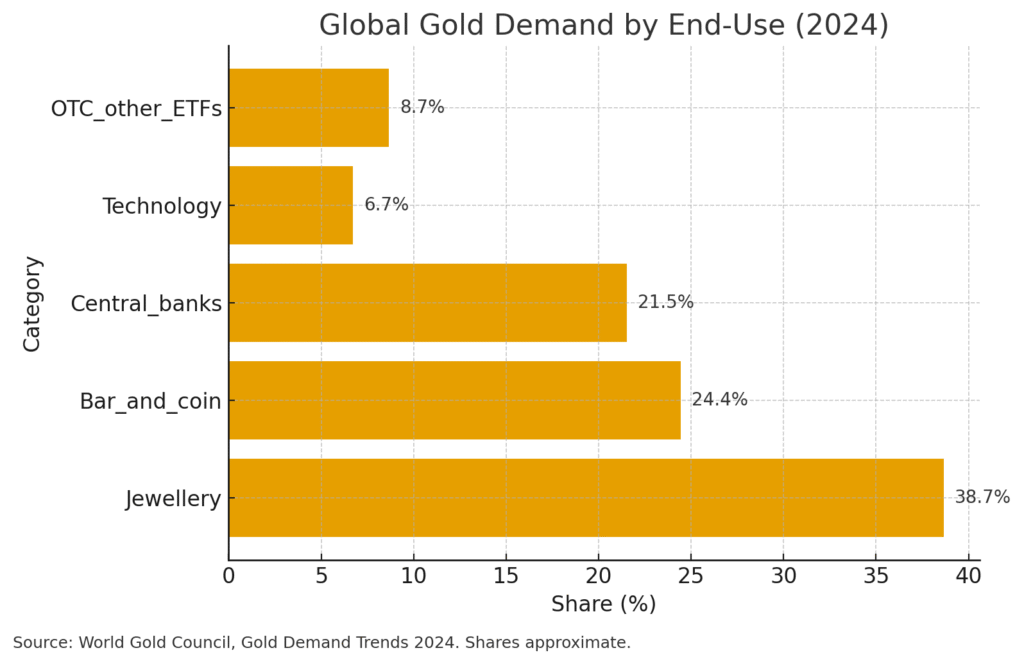
The World Gold Council (2024) shows demand split roughly as 38% jewellery, 24% bar & coin, 22% central banks, 7% technology, and ~9% OTC/other (WGC Gold Demand Trends 2024). Central banks added 1,000+ t in 2024 and resumed net purchases in Aug-2025 after a brief July pause. That matters because official-sector buying is steady and less price-sensitive, which tightens available float, supports prices even during ETF outflows, and signals ongoing reserve diversification. (WGC central banks update).
Today’s geography of global gold flows
Top importers in 2024: Switzerland, China, the UK, Hong Kong, and India—together ~70% of world imports (World’s Top Exports). Asia bought the most by value ($332 bn, 58%), followed by Europe (36%) and North America (4.5%) (same source).
Within Asia, the Shanghai Gold Exchange is expanding fast. Demand for 1 kg bars helps explain Swiss shipments to Hong Kong and Shanghai. The DMCC in Dubai and India’s jewellery hubs in Mumbai and Surat channel bullion to consumers. New York and Singapore connect Western investors through futures and storage.
Central banks, especially in BRICS+, keep accumulating gold as a hedge against currency risk and geopolitics. Poland plans to raise gold’s share of reserves from 20% to 30% (WGC update). Meanwhile, sanctions and tariffs can reroute flows overnight. U.S. tariffs on 1 kg bars boosted Swiss shipments to the U.S. in early 2025 (AFP/FashionNetwork). Russian bullion moved eastward via Dubai and Hong Kong. Finally, liquidity cycles and a strong dollar often pull ETF holdings lower and push more metal toward Asia.