If you only watch the gold price, you miss the real story: where the metal actually comes from—and how the top gold producing countries quietly shape liquidity, trade flows, and even geopolitics. In 2024, global mine output edged up to roughly 3,300 tonnes, and just five producers supplied about 41% of that total. We’ll count down from #5 to #1 (save the crown for last), then step back to explain why this matters.
A 90-second origin story (that took 5,000 years)
Gold’s monetary role pre-dates modern finance by millennia, but the part relevant to today’s market begins in the 19th and 20th centuries. Nations embraced a gold standard to stabilize exchange rates; then, under the stress of depression and war, most abandoned convertibility. The definitive break came in August 1971, when the U.S. ended the dollar’s convertibility to gold, closing the Bretton Woods chapter and ushering in the fiat currency era. Gold stopped backing money—but it kept backing confidence. In every inflation scare, banking wobble, or geopolitical shock since, investors and central banks have reached for the yellow metal.
Why gold still matters in a fiat world
Three reasons. First, safe-haven behavior: gold has no credit risk and a finite above-ground stock, so it tends to hold purchasing power when paper assets are out of favor. Second, official demand: central banks treat gold as reserve insurance, a diversification away from single-currency exposure. Third, broad, steady use: outside of investment, the metal disappears into jewelry cases and circuit boards. In 2024, consumption (ex-ETFs) broke roughly into jewelry (45%), central banks & institutions (21%), bars (19%), coins (7%), electronics (6%), and other (1%)—a mix that stabilizes baseline demand even when investor flows swing.
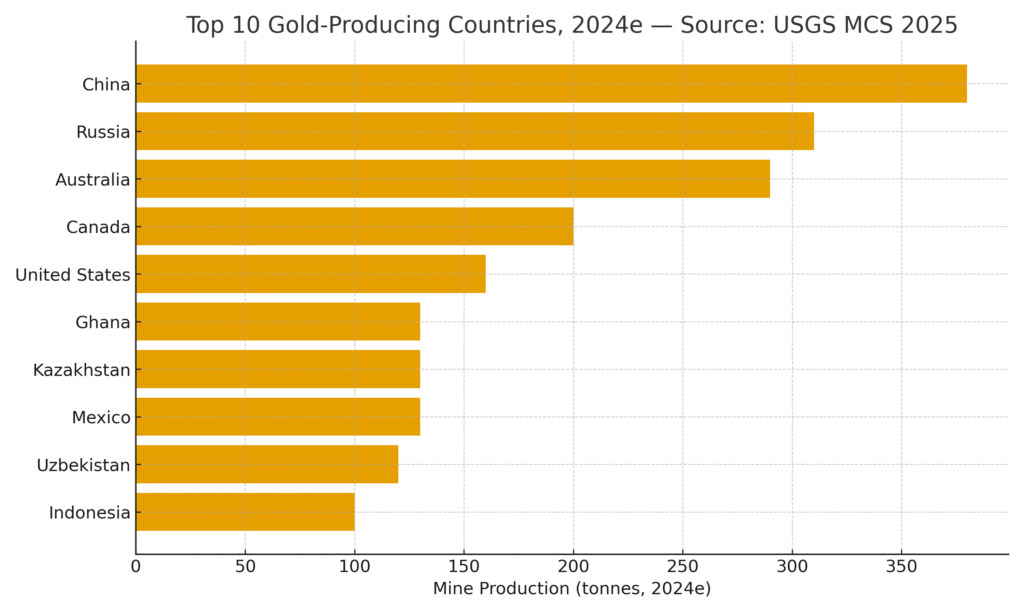
The 2024 countdown: top gold-producing countries
#5 — United States (≈160 t)
American gold is overwhelmingly a Nevada story. In 2024, Nevada accounted for about 70% of U.S. mine output, with Alaska at ~16%; the rest comes from a scatter of Western states. The production base rests on Carlin-type deposits that still deliver scale even as grades drift lower. In recent years, joint-venture synergies (notably the Nevada Gold Mines JV) and processing improvements helped offset the natural decline curve at mature pits. The constraint to watch isn’t geology as much as permitting timelines and capital discipline in a higher-rate world. For a global market that often settles price via New York futures, U.S. mine supply is smaller than many assume—but its derivatives market clout is vast.
#4 — Canada (≈200 t)
Canada’s production is concentrated in two provinces with deep mining DNA: Ontario and Québec together accounted for about 70% of national output in 2023. That concentration reflects century-old greenstone belts like the Abitibi and modern large-scale operations that anchor local economies. Canada is also a midstream hub: dore and refined bars move efficiently into global trading circuits, often linking through London’s OTC network. On the macro side, gold was Canada’s top-ranked mineral by value of production in 2023, underscoring the sector’s economic weight. The near-term swing factors are energy costs, labor availability in remote regions, and the permitting clock on new underground expansions.
#3 — Australia (≈290 t)
Australia’s footprint is both large and reliable. Western Australia’s Goldfields—home to Kalgoorlie’s Super Pit and other tier-one operations—remain the backbone, while New South Wales adds scale via big, low-cost porphyry deposits. Australia exports most output, often as dore routed through Swiss refiners, before bars circulate into London, Asia, and the Middle East. The risks here are operational more than geological: weather interruptions, energy inputs tied to LNG markets, and a tight labor pool. Against that, policy stability, infrastructure, and technical depth keep Australia near the top of the table year after year.
#2 — Russia (≈310 t)
Geology is generous; geopolitics is not. Russia’s giants in Siberia and the Far East—anchored by super-scale mines—deliver steady tonnage despite sanctions. Trade routes have shifted decisively east and south, and settlement currencies are more diverse, but production volumes remain substantial. What can change quickly is market access: changes to sanctions, logistics insurance, or refiners’ accreditation can reroute flows almost overnight and affect how easily Russian-origin gold reaches major trading centers. For price, that means Russia sits in the “policy sensitivity” seat: not the biggest producer, but one whose access terms can add friction to global liquidity.
#1 — China (≈380 t)
China has led world mine output for years, with large contributions from Shandong and other eastern provinces. What differentiates China isn’t just volume but absorption: strong domestic investment and jewelry demand, plus regulatory controls around exports, mean a significant share of mined metal stays within the country’s orbit. China also runs one of the world’s most important physical venues in the Shanghai Gold Exchange (SGE), which complements London’s OTC market and U.S. futures in the global price-discovery ecosystem. When Chinese demand tightens—due to currency weakness, savings preferences, or policy—global float shrinks, and spot premiums can flare across Asia.
The plumbing behind the headline: refining and trading hubs
Mine output is just the first act. Most dore is upgraded into good-delivery bars before it qualifies for wholesale liquidity, and Switzerland remains a pivotal conduit thanks to its cluster of world-class refiners. Once bars meet wholesale specs, three markets dominate: London’s over-the-counter (OTC) network (check out our last article here), U.S. futures (COMEX), and the Shanghai Gold Exchange. Together, these venues account for the overwhelming majority of global turnover and set the rhythm for pricing and liquidity across time zones. The order of operations often looks like this: mine → refiner → London OTC vaults (or Asian hubs) → leveraged hedging or futures positioning on COMEX → physical offtake where jewelry and investment demand are strongest. In periods of extreme stress—say, when U.S. futures trade at a premium to London spot—metal can physically fly across the Atlantic to rebalance spreads.
Demand anatomy in 2024: the ballast beneath the price
One reason gold works as a financial stabilizer is that non-financial demand is broad and persistent. Jewelry absorbs nearly half of annual offtake. Electronics—small in tonnage—adds a floor thanks to ubiquitous connectors and bonding wires. Meanwhile, central banks and official institutions have emerged as the market’s quiet heavyweight bid, lifting reserves to diversify risk. The 2024 breakdown—jewelry 45%, central banks & institutions 21%, bars 19%, coins 7%, electronics 6%, other 1%—captures why price selloffs can stall: when investor flows turn, the physical world is still buying.
What to watch next (and why it matters)
Policy beats geology in the short run. The five leaders have ample resources, but prices react fastest to rules and routes. For the U.S. and Canada, that’s permitting certainty and timelines; for Russia, it’s sanctions and refiner acceptance; for China, it’s the degree of domestic absorption and any change to export or import regimes. In Australia, labor and energy costs set marginal economics. Any sudden policy change can ripple through London vaults and futures spreads within days.
Concentration risk is real. With about 41% of mine supply coming from five countries, a single disruption—from a strike to sanctions tightening—can shift global flows and raise physical premia in key hubs. The market has redundancy (recycling, ETF stockpiles, central-bank leasing), but logistics frictions and accreditation rules can make metal “sticky.”
The bottom line
The top gold producing countries in 2024—counting down from the United States, Canada, Australia, and Russia to #1 China—explain far more about gold’s behavior than the daily price chart. Mines determine where the ounces start; refiners and trading hubs determine how those ounces become liquidity. And in a world where central banks are net buyers and investors still prize insurance, the pipeline from pit to price remains a strategic asset. If you track policy shifts in these five producers and watch the pulse across London, COMEX, and Shanghai, you’ll often understand tomorrow’s moves before they show up in the ticker.
Sources
-
USGS Mineral Commodity Summaries 2025 (Gold chapter). 2024e world mine output (~3,300 t), country rankings, U.S. state shares (Nevada ~70%, Alaska ~16%). U.S. Geological Survey
-
World Gold Council — Global Gold Market. Explains the primacy of London OTC, U.S. futures (COMEX), and the Shanghai Gold Exchange in global trading volumes. World Gold Council
-
Natural Resources Canada — Gold facts. Ontario and Québec ≈70% of Canada’s 2023 output; broader production context. Natural Resources Canada
-
Investopedia — Gold standard history. 1971 end of dollar convertibility to gold; Bretton Woods context. Investopedia